How to debug JavaScript in a Visual Studio 2013 ASP.NET Web Application
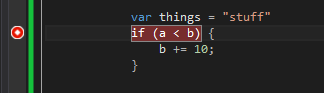
I've been struggling trying to debug my JavaScript in ASP.Net Web Applications under Visual Studio 2013, it lets me place a breakpoint in the script:
But then I hit F5 to run my application under the debugger and it gives me "The breakpoint will not currently be hit. No executable code of the debugger's target code type is associated with this line":
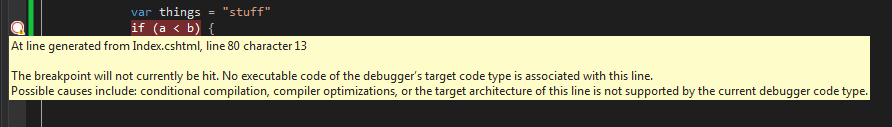
Which is a bit rubbish. I'm sure they have their reasons for letting me place a breakpoint and then so cruelly toying with my emotions in this way but still, it doesn't help me single-step through the nail-biting outcome of my (a < b) conditional, which is frustrating to say the least.
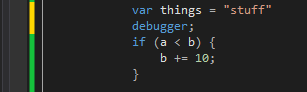
Although not ideal (as it involves making code changes to your code), you can cause Visual Studio to break during execution by adding the keyword
debugger;
to your code like this:
Fire up the debugger again and you'll find it break at the line.
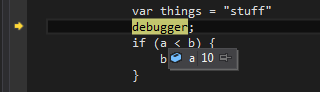
It seems to strip out any syntax highlighting while its in this state but at least you can hover over fields to see their value and use the Immediate Window and all the usual Debugger trickery pokery without having to resolve to something like Firebug or IE's F12 Developer Tools.
A big shout out to my good friend Jarek for showing me this. Check out his awesome productivity extension for Visual Studio, VSCommands.